Abstract
Plants change throughout the growing cycle, while many facilities continue to operate with the same setpoints.
Phenological stage, radiation, biomass and production targets call for dynamic strategies.
Why treat a plant the same way when it changes every day?
Think of a newly transplanted lettuce and that same plant a few days before harvest. Its leaf area, root system and biomass are substantially different. Leaves overlap, light penetrates the canopy differently, and air encounters new obstacles. Water and nutrient uptake change, as does the crop’s contribution to the moisture balance of the growing environment.
Yet the cultivation programme may remain identical: the same light intensity, irrigation intervals, temperature and humidity settings.
This observation points to a direction we are interested in developing at GREAT IT: identifying indicators that reveal how the crop is progressing and using them to guide management decisions, with support from artificial intelligence.
How to tell whether the crop is meeting its targets
In business management, we use performance indicators to assess whether results are in line with expectations. The same reasoning can be applied to cultivation.
Growth rate, uniformity, quality and resource consumption per unit of product allow us to evaluate a cultivation recipe through the results it delivers. Some indicators are measured at harvest; others can be monitored throughout the cycle, while there is still time to intervene.
We can observe how quickly the canopy expands, how water consumption changes, or how much individual plants within the same batch differ from one another.
To make this information useful, we need a reference: what development pattern should we expect from that cultivar, at that stage and under those conditions? When is a deviation part of normal physiological variation, and when does it warrant further investigation?
Research is already developing these tools
Studies are already using images and machine learning algorithms to estimate crop traits without having to rely on destructive sampling for every measurement.
A study published in 2022 combined colour images, depth images and plant geometric traits to estimate lettuce shoot fresh weight through deep learning. It provides a concrete example of how visual observations can become quantitative measurements for tracking growth. Automatic monitoring of lettuce fresh weight by multi-modal fusion based deep learning
Another study demonstrated the possibility of estimating lettuce biomass by combining a low-cost commercial RGB-D camera with a deep learning model. Non-destructive Plant Biomass Monitoring With High Spatio-Temporal Resolution
These results provide a foundation for developing decision-support systems. Accurately estimating growth, however, is only one step: recommending an intervention requires connecting that growth with environmental conditions, the crop’s history and the production target.
Which sensors can help us?
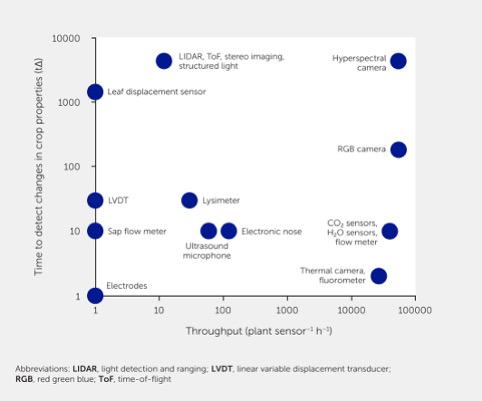
Sensing technologies offer different tools for observing the environment and plant responses.
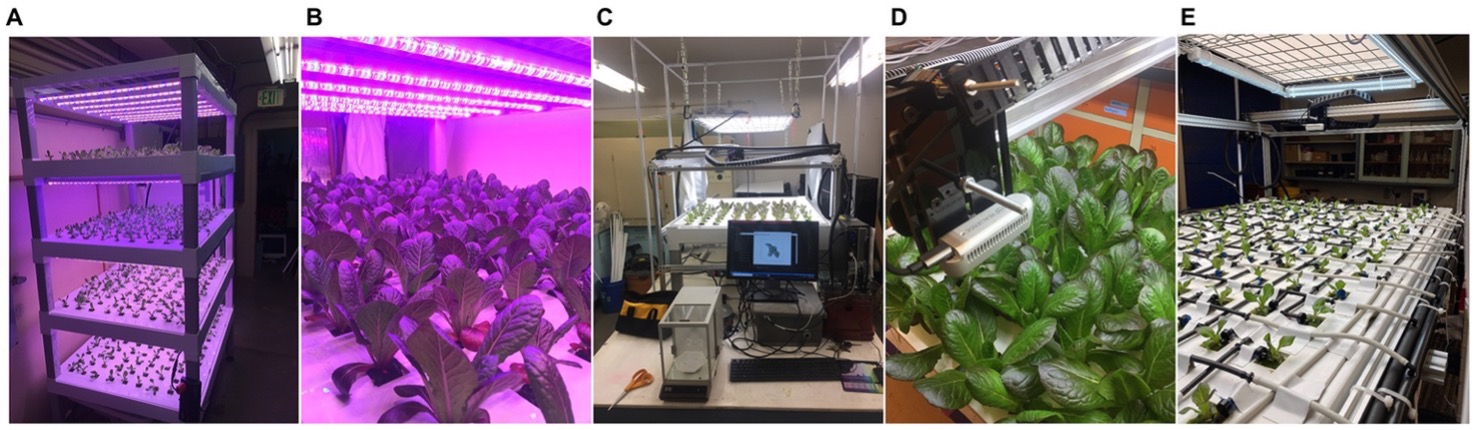
Air temperature and humidity, CO₂, photosynthetically active radiation, nutrient solution temperature, pH and EC describe important growing conditions. These measurements can be complemented by tools that observe the crop more directly:
These techniques are already used in plant phenotyping: the measurement of observable plant characteristics and their responses to the environment. More sophisticated platforms, particularly hyperspectral systems, can involve substantial costs and require specialist expertise to acquire and interpret the data. A Review of Imaging Techniques for Plant Phenotyping
PlantEye and advanced phenotyping
One example of advanced instrumentation is PlantEye by Phenospex, which combines three-dimensional scanning with multispectral acquisition. It provides parameters such as plant height, three-dimensional leaf area, canopy coverage and spectral indices, allowing repeated, non-destructive measurements of the same plants.
Its outputs also include “digital biomass”: a geometric indicator that needs to be related to actual biomass through appropriate experimental validation. PlantEye technical documentation
Instruments at this level are particularly valuable for research, allowing differences between genotypes, treatments and growing conditions to be tracked over time.
For a production facility, the choice also requires an economic assessment. What additional information do we obtain? Which decision does it help us improve? And how much is that improvement worth compared with the cost of acquiring, integrating and operating the measurement system?
One possible approach is to use advanced instrumentation during experimentation to identify the most informative indicators, then assess which of them can be monitored in production using simpler solutions.
The plant changes the environment we are measuring
In our previous article, we described transpiration through the vapour gradient and the resistances that regulate exchange between the leaf and the atmosphere.
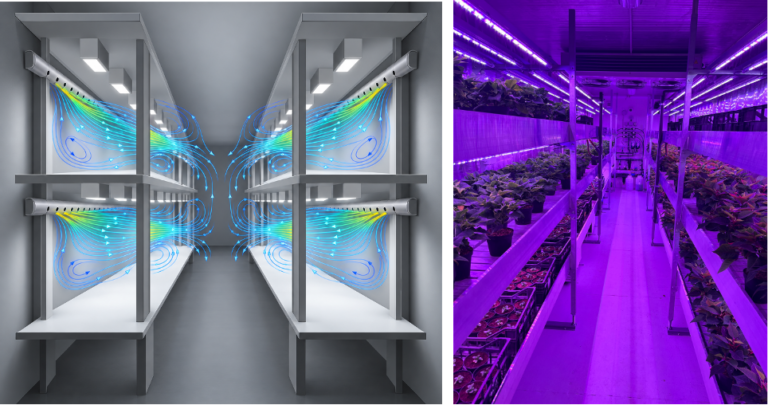
As the canopy develops, some leaves may occupy less ventilated areas. Water vapour is removed less effectively, and the microclimate near the leaf surface may differ from the conditions measured by the room sensor.
The control system continues to register the target value, while some plants are already experiencing different conditions.
This is why environmental measurements become meaningful when connected with crop observations. Sensor positioning, measurement frequency and developmental stage all become part of the design.
From data to AI recommendations
Imagine collecting environmental data, growth indicators, resource consumption, management interventions and harvest results, cycle after cycle. Each observation retains its context: cultivar, density, developmental stage and operating conditions.
This progressively builds a richer dataset on which to develop and test models capable of identifying deviations and useful relationships.
A practical first objective is a system that flags unexpected trends and suggests possible interventions to the grower. The proposed action is assessed, implemented within defined limits and evaluated through the plants’ response.
Recording the outcome of each intervention also allows us to update the available knowledge and, following appropriate validation, improve the models. Slower growth can have several different causes: the quality of a recommendation depends on the ability to interpret multiple sources of information together.
Research on dynamic control in vertical farming is already exploring the connection between crop monitoring, models and the adjustment of environmental conditions. Kaiser et al., 2024
Every decision must also work within the facility
Changing the lighting strategy alters the distribution of thermal loads. Changing air movement affects exchange between leaves and their environment. A change in water demand requires irrigation management that can respond accordingly.
Even a recommendation based on reliable data must therefore be compatible with the facility’s actual capabilities and the interactions between its components.
This is where plant physiology, agronomy, sensing technologies and engineering need to work together.
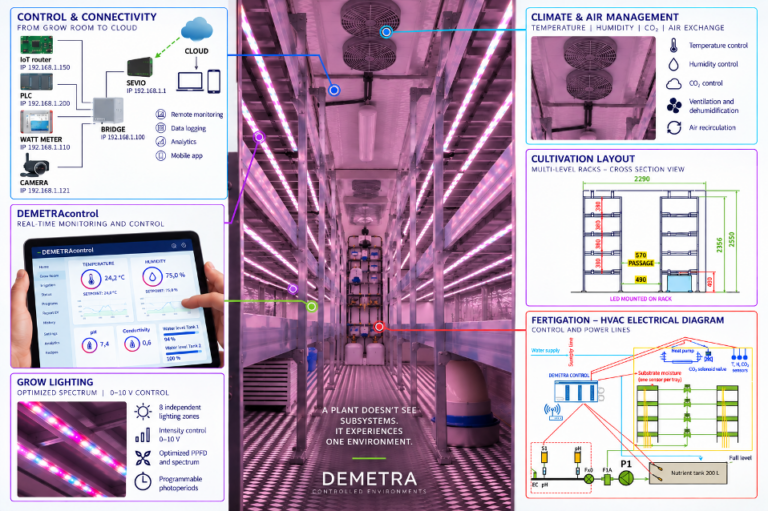
Within GREAT IT’s development process, DEMETRA provides an environment in which to test these relationships: comparing protocols, assessing indicators and determining whether a change delivers a repeatable benefit before transferring it to industrial scale.
This is the work that interests us: developing cultivation systems that can put what we learn from plants into practice. Every cycle adds information; every validated intervention can make the next decision more precise.
Which indicators do you consider most useful for deciding when to change your cultivation strategy?
References
Technical documentation
#ControlledEnvironmentAgriculture #VerticalFarming #PlantPhysiology #PlantPhenotyping #AdaptiveCultivation #ArtificialIntelligence #SmartFarming #PrecisionAgriculture #GreatIT #DEMETRA